ODU Resources

You moaned and I responded. Here are just the notes for the ODU section, no questions to put you off. I will move the questions to the Learning Outcome Booklet.

ODU Notes and Practicals

Updated for the 2018 changes

Part 1, containing notes, tutorials and practicals

OUR DYNAMIC UNIVERSE 2018 pdf

OUR DYNAMIC UNIVERSE 2018 word

Part 2 of the notes in word format, you can adapt these if you can open them.

These are part 2 of the notes in pdf format, so you all ought to be able to open them.

OUR DYNAMIC UNIVERSE part 2 

Well after spending 18 months or more several years ago putting everything together students have unanimously declared they want everything separated, so your wish is my command students- here is the complete Our Dynamic Universe section notes with nothing but the essential practicals plus one!

These are part 1 of the notes in pdf format, so you all ought to be able to open them. There is a word version underneath.

These are part 1 of the notes in word format, you can adapt these if you can open them.

New for 2022 KNOWLEDGE ORGANISERS

Teamwork by Mr Stewart (Berwickshire HS) and I. He designed and made them and I tweaked them. Thanks Mr Stewart they’re ace!

Thanks Mr R Stewart- what a team!

Thanks Mr R Stewart!

For those having trouble with Unit 1 part 1 try this little document

1. 1a Equations of motion

1. 1a Equations of motion

I’ve removed the Time Dilation detailed version and added it as a separate document as I suspect most of you wont read them; which is a pity as it makes everything seem fine! Based on Russell Stannard’s excellent book “Relativity- a very short introduction” Oxford. (2008)  ISBN 978–0–19–923622–0)

ODU worked ANSWERS_4 Currently the most up to date version of the worked answers.

ODU worked ANSWERS_4 The pdf version of the most up to date version of the worked answers.

Additional Support

Chapter 1 exam questions B for CFE higher

Chapter 1 exam Answers B for CFE higher

These are powerpoints prepared for the Revised Higher in 2000. They are still relevant now, and talk through example questions. They are great for revision.

It might be old, but sometimes the old ones are the best. Link for the ppp below!

Linked to some talking questions and answer. ppp below

For those struggling with the vectors try these to give you some practice Great Resource from Mr Crookes. Set up your 2 vectors, either use a scale diagram or components and compare to the given answer. Enjoy!

If you don’t like proving v2=u2+2as from v=u+at then use this neat little sheet from Mr Mackenzie.

A lovely little summary from G Gibb!

Equations of Motion

4.4 ODU EqoM 2012 this document has the macros enabled (actually I think you might need to contact me to get the macros, they are not allowed to be uploaded on a WordPress Website. It allows you to check your answers for the acceleration time graphs that you drew from the velocity time graph diagrams.

using displacement equation to prove the last equation

Click on the image to open a power point of Adding Vectors.

Forces, Energy and Power

Momentum

africanfastfood This is an introduction to the momentum topic; think about the collision and where the energy is transferred.

Collisions- Think Safety before buying a car!

Gravitation

Projectiles thanks to Mr. Rossi for this one.

Battleships & AWACS Projectiles thanks to Mr. Rossi for this one too.

Special Relativity

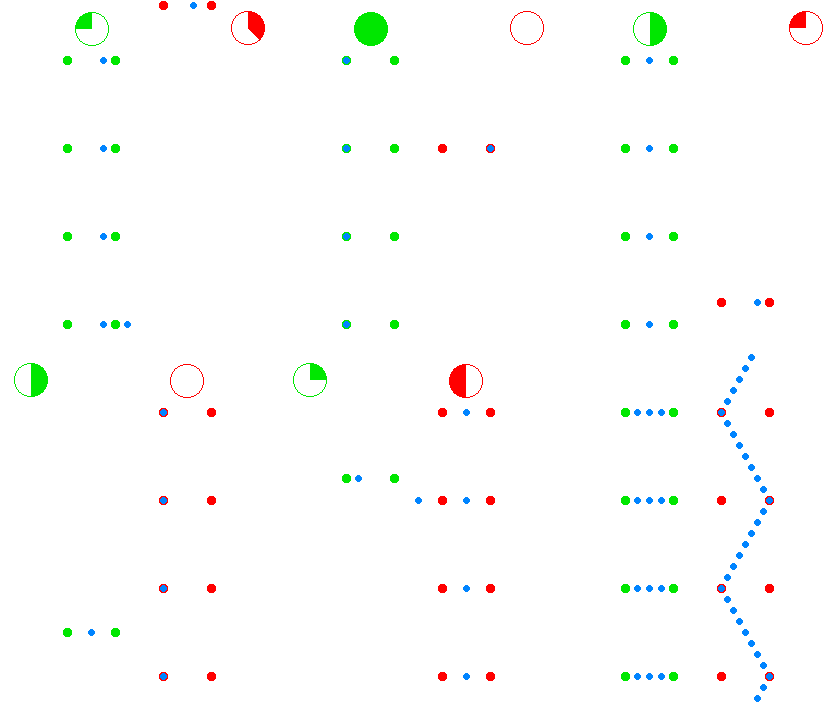
Time dilation02

Cleonis [CC BY-SA 3.0 (http://creativecommons.org/licenses/by-sa/3.0/)]

The green dots and red dots in the animation represent spaceships. The ships of the green fleet have no velocity relative to each other, so for the clocks onboard of the individual ships, the same amount of time elapses relative to each other, and they can set up a procedure to maintain a synchronized standard fleet time. The ships of the “red fleet” are moving with a velocity of 0.866 of the speed of light with respect to the green fleet.

The blue dots represent pulses of light. One cycle of light-pulses between two green ships takes two seconds of “green time”, one second for each leg.

{\displaystyle {\sqrt {3}}}

As seen from the perspective of the reds, the transit time of the light pulses they exchange among each other is one second of “red time” for each leg. As seen from the perspective of the greens, the red ships’ cycle of exchanging light pulses travels a diagonal path that is two light-seconds long. (As seen from the green perspective the reds travel 1.73 ({\displaystyle {\sqrt {3}}}) light-seconds of distance for every two seconds of green time.)The animation cycles between the green perspective and the red perspective, to emphasize the symmetry.

OnVelocities This is a document referred to in the Research Task in the ODU part 2 notes.

PHYSICS WORLD ARTICLE DECEMBER 2009 This is a document referred to in the Research Task in ODU part 2 notes

The Expanding Universe

The expanding universe powerpoints. Might not be quite the final version

This is the pdf version of the powerpoint

The above is the pdf version of the powerpoint

Are we missing something in the Expanding Universe?

AH (Doppler)– some of this is relevant to Higher.

HOMEWORK

The homework booklets are now in the HOMEWORK section.

Homework Booklet Complete pp6-8 (first question), 10-16, 18. Complete notes on Units prefixes and Sci Notation, Uncertainties, Equations of Motion. Read up on Forces.

Updated August 2019
Signature

What is the Biggest Ever Redshift?

A discussion on the Physics Teachers’ Network requested advice on “What is the biggest ever redshift detected?”

Research shows it was a redshift, z = 11.09 for galaxy GN-z11; and the measurements were  taken in the near infra red using Hubble’s Wide Field Camera. 

This is a big question because effectively we are seeing the furthest galaxy back in time.  It is 32.2 billion years away and came into existence 400 million years after big bang.  So if the Universe is only 13.8 billion years old then how come we can see something so far away?

During this time the Universe was opaque and full of neutral atoms.

Professor Martin Hendry supplied an interesting reply.

In some cases we can determine the redshift of a galaxy by measuring the wavelength of a particular spectral line that corresponds to a particular transition of an electron in a hydrogen atom.  For example the Lyman alpha emission line is the result of an electron dropping down from the n=2 energy level to the n=1 energy level, and the presence of this spectral line is often seen as an indicator of a recent burst of new stars forming as one might expect to see in a very young, recently formed galaxy.  (This line was proposed as a tell-tale sign of a very young galaxy by Bruce Partridge and Jim Peebles – awarded the Nobel Prize for physics this week: see e.g. https://en.wikipedia.org/wiki/Lyman-alpha_emitter).  This line has a wavelength of 121.567 nm in the rest frame of the hydrogen atom.  If a galaxy is a strong Lyman alpha emitter, and the line is observed at wavelength lambda, then by comparing the observed wavelength with the 121nm at which it was emitted we can measure the redshift of the galaxy.

(Of course if this spectral line is redshifted then how do you know it’s a Lyman alpha line?  Likewise for any other spectral line.  Often it’s the combination of several spectral lines and their relative spacing that gives the game away – a bit like a bar code in the supermarket.  You could imagine enlarging the image of a bar code in a photocopied and, generally, it’d still be recognisable as the overall pattern would still be the giveaway).

In fact for this record-holding galaxy, the redshift was determined a slightly different way, from the Lyman series but not the Lyman alpha line and not from an emission line but an *absorption* line: specifically it was determined from the “Lyman break” – i.e. the limiting wavelength that corresponds to the amount of photon energy you need to absorb to allow an electron in the n=1 energy level to escape from its hydrogen atom altogether.   That is a higher energy (and so a higher frequency, and a shorter wavelength) than the Lyman alpha line, and in fact corresponds to about 91 nm in the rest frame of the hydrogen atom.   Any photons that have even higher energies (and thus even shorter wavelengths) than this get absorbed by the (lots of) neutral hydrogen that is around in the Universe at that time; these photons thus *ionise* that neutral hydrogen.  This is sometimes referred to as “re-ionisation” in the sense that the universe was fully ionised when it was much younger, because it was much hotter, then it cools enough for neutral hydrogen to form – i.e. when the CMBR was emitted – and now it’s being ionised again.  Where are the high-energy photons coming from to do this ionising (being absorbed in the process)?  They are believed to come from hot young stars – i.e. the newly formed stars in these young galaxies.  (Remember, the more massive the star the hotter their surface temperature, so massive blue stars emit lots more of these energetic photons than cooler red stars do).

So, in summary, the spectrum of light from a galaxy as a whole drops off at the Lyman break, like a “cliff edge” because at shorter wavelengths than the Lyman break these photons get absorbed, ionising the hydrogen gas in their environments.

You can then play the same game as with an emission line: look for where this “cliff edge” appears in the observed spectrum and then use that observed wavelength (which will be much longer than 91nm) to estimate the redshift.

The research paper on GN-z11 is at https://arxiv.org/pdf/1603.00461.pdf, and is actually pretty readable I think…

Other references:

https://www.youtube.com/watch?v=vIJTwYOZrGU

https://www.space.com/32150-farthest-galaxy-smashes-cosmic-distance-record.html

Another clear explanation from Prof. Hendry, who never makes us teachers feel silly for asking questions. Thanks to Mr Thomson and his student for the original question.

Special Relativity

Resources for Special Relativity

Here is a link to a fantastic little book that started me on my “very short introduction” library. It has been uploaded as a pdf file, but if you enjoy it give the author some credit and pay the guy (Russell Stannard) by buying it!

Relativity-A-Very-Short-Introduction.pdf

Frames of Reference

You should all try to make your holiday videos so useful in showing Physics ideas! Who is in motion? Does it remain the same throughout the sequence?


This is covered in the web-based research post but I’ve uploaded it here as an MP4 file.

Just check this off against the content as it isn’t all covered at Higher (some is the AH and some isn’t covered at all).

Neil deGrasse Tyson with his inimitable style explains the Michelson-Morley experiment and shows that despite getting a rubbish result it doesn’t say your results are rubbish! This was big Science progress and it wasn’t explained until Einstein came along. It was the turning point that transformed Science.

Here are further explanations of the Michelson-Morley experiment and a hint of more of the course to come.

Evidence for Special Relativity

Sixty symbols- Nottingham University

Sixty Symbols by Nottingham University are an amazing set of videos, although far more than sixty by now. Check out and keep watching.

…. and here at the end I have uploaded the worked answers (thanks to whoever wrote these excellent questions) so that you can check off your tutorials.

ODU worked ANSWERS_5

Our Universe tutorial solutions

Signature

updated October 2019


The Expanding Universe Practical

A great little practical with washers, that was used as an exam question!

Try the following practical

http://www.schoolsobservatory.org.uk/astro/cosmos/uniball

expanding universe school observatory

Expanding Universe Experiment

To understand how the redshift of galaxies is due to the expansion of the Universe, try the following experiment.

You will need the following items:

  1. A round balloon (do not use a long, thin one).
  2. Some coloured stick-on dots (at least 5 different colours).
  3. A piece of string about 50cm long.
  4. A ruler.
  5. A stopwatch or other timer.

Step 1 : Setting Up

You will need to work in teams of at least two, one to blow up and hold the balloon and the other to make the measurements.

Before you start, draw a table for your results like the one below with the colours of your five dots in the 1st column:

Colour of DotFirst Distance D1 in cmSecond Distance D2 in cmChange in Distance        D2 – D1 in cmSpeed v in cm/second
Red    
Green    
Blue    
White    
Yellow    
Time to fully inflate the balloon:        seconds.

Step 2 : Making the Measurements

Putting dots on the small balloon

Blow up the balloon a little bit and hold the “nozzle” closed, but do not tie it up.

Stick your five dots onto the balloon. Try to spread them out over the whole balloon.

stick dots

Each of the dots represents a whole galaxy, with the surface of the balloon being the Universe that they exist in.

Choose one of the dots to be your “home”. You can choose any of them.

Step 3

Use string to measure the distance between two dots

measure dots

While one of you holds the balloon, the other one can use the string to measure the distance from your “home” dot to one of the other dots.

Now measure the string distance with a ruler.

When you have measured the distance, write it down in your table in the D1 column.

Step 4

Measure the distances from the “home” dot to all the other dots as well and fill in that column of the table.

Note: The distance from your “home” dot to itself is zero.

Step 5

Now carefully blow the balloon right up, using the stopwatch to time how long it takes. Write down the time in seconds.

Step 6

Now re-measure all the distances from “home” to all the other dots and write then down in the D2 column of your table. Don’t forget that the distance from your “home” dot to itself is zero.

You now need to work out the speed of each galaxy. Remember that:

Here, the Distance travelled is the difference between D1 and D2, so calculate D2 – D1 for each of our dots and write them in the 4th column on the table.

Step 7

The Time taken is the time to blow the balloon up. Work out the speed V for each dot and put it into the 5th column. Because your “home” dot has not moved, its speed will be zero.

Step 8

We are studying how the speed that galaxies seem to have gets larger for galaxies that are further away.

The best way to see this is to plot a graph showing the distance along the bottom axis and with the speed up the side.

This means that you need to plot a graph with axes like the one below:

speed v distance

Put the points for all your dots on the graph using D2 as the Distance.

Step 9 : What does it all mean ?

Use the ruler to draw a straight line that goes as close to as many of the points as possible (don’t forget the “home” dot!)

Think about the following questions and discuss them:

  • Are the speeds of all the dots the same?
  • If not, do they get faster or slower as they get further from the “home”?
  • What would be different if you had chosen a different “home”?
  • What would have been the same?
  • What do you think this tells you about the way that the Universe expands and the redshift of galaxies?

If you are not sure about some of the questions, can you think of a way changing the experiment to make them easier to answer?


Signature
Updated November 2022

Preferences