
The AH today were working in 3 groups to research via practicals and notes about SHM. The task is given below. Well done to Morford and Hodgson who created the following from their practical, with very little assistance. Their results were so good I thought I’d share them.
Mr Morford wrote
Morford & Hodgson (2019)
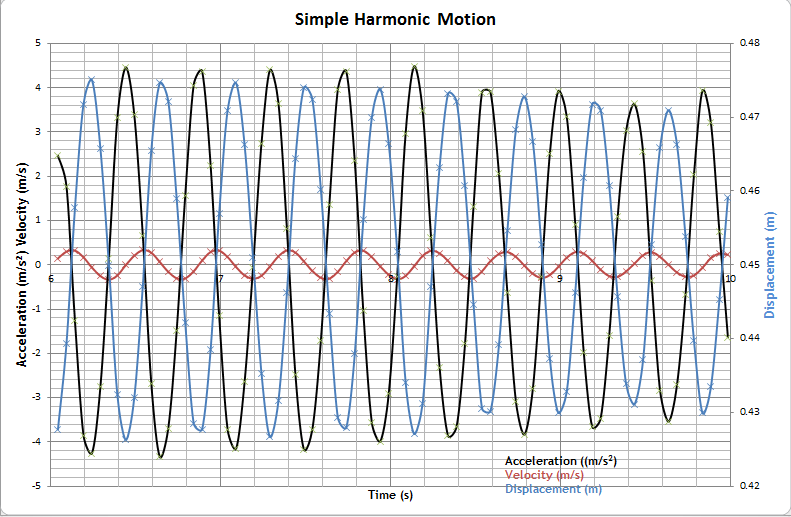
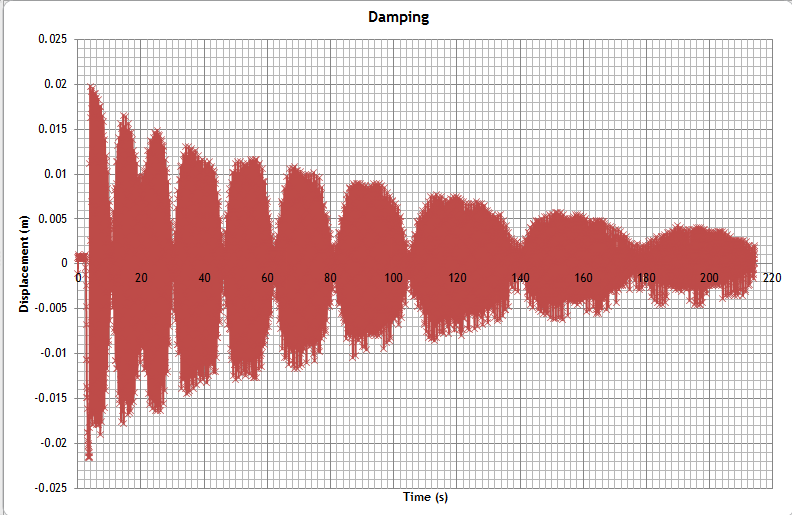
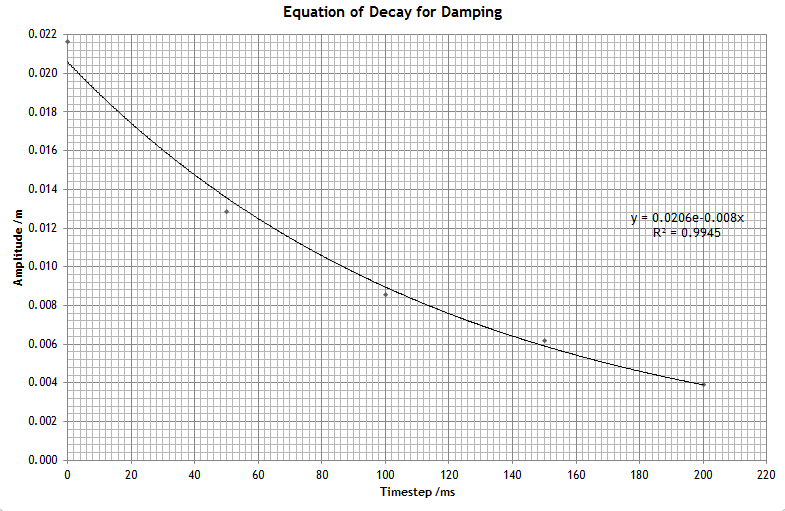
“These graphs are from our recent experiment to determine the effect of damping on an oscillating mass. A mass was hung from a spring over an Alba Ranger ultrasound device. We then analysed our measurements using excel and graphed our results to find the decay due to damping.”
This was the task for the class and my thanks to the IoP for their Practical Physics lessons and to the other places referenced for some great practical techniques. I will neaten this post later, but I promised Morford and Hodgson that I would post tonight!
Hopefully I can collate the rest of the groups information soon.
By the end of the lesson you should……
- You to have the spring constant for two of the springs by two different methods.
- A graph of d against t, v against t, and a against t
- A value of the period of spring for various masses
- Discovered the effect of amplitude on the period Found the effect of damping (so find out what that is)
https://www.webassign.net/question_assets/ncsucalcphysmechl3/lab_7_1/manual.html
https://www.cyberphysics.co.uk/topics/shm/springs.htm
http://practicalphysics.org/investigating-mass-spring-oscillator.html
2020
Despite Covid-19 the intrepid AH students have been showing damping with a pendulum bob and tracker. The original movie has still to be analysed by our friends from Annan
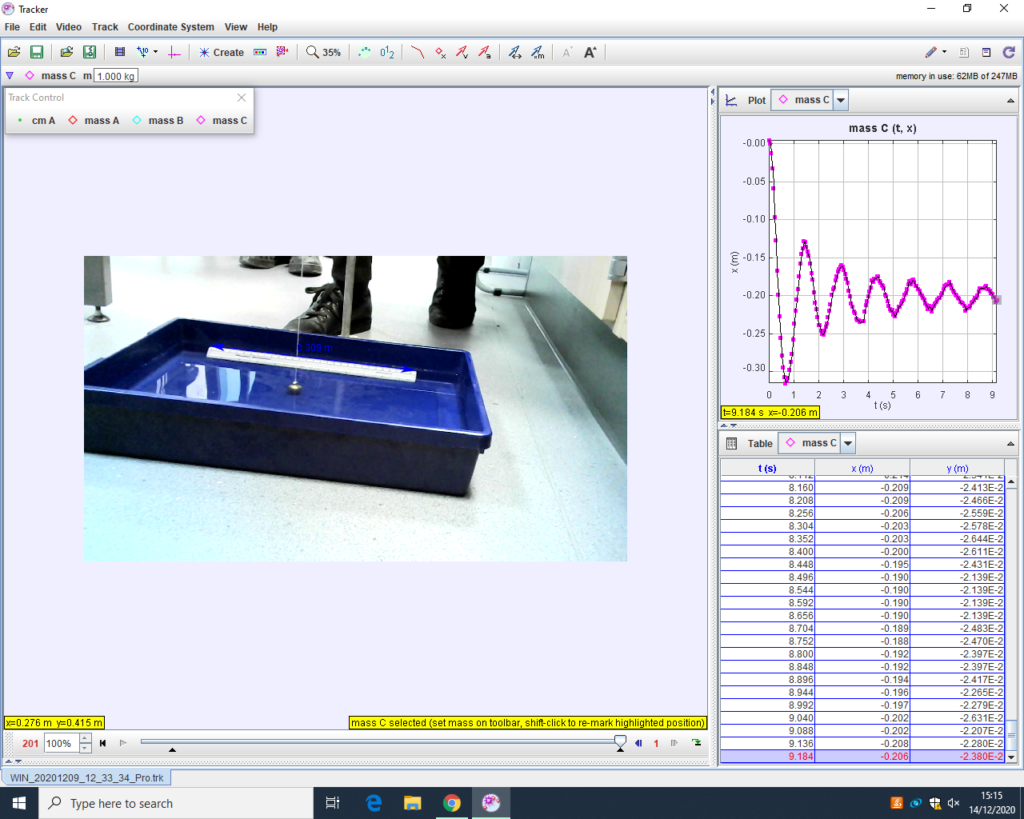
Now if we can add Atwal, Burns, Carson and Morrin’s tracker we can have a full set for 2020 and you can look back with fondness at your time in AH, despite all the distancing.
Investigating a mass-on-spring oscillator
Demonstration
A mass suspended on a spring will oscillate after being displaced. The period of oscillation is affected by the amount of mass and the stiffness of the spring. This experiment allows the period, displacement, velocity and acceleration to be investigated by datalogging the output from a motion sensor. It is an example of simple harmonic motion.
Analysis
Measurement of period
Period and Amplitude Observe that the period appears to be independent of amplitude.
Effect of mass
A straight line is the usual result, showing that the period squared is proportional to the mass.
Velocity and acceleration
A plot of the resulting data shows a ‘velocity vs. time’ graph. Note that the new graph is also sinusoidal. However, compared with the ‘distance vs. time’ graph, there is a phase difference – the velocity is a maximum when the displacement is zero, and vice versa.
A similar gradient calculation based on the ‘velocity vs. time’ graph yields an ‘acceleration vs. time’ graph. Comparing this with the original ‘distance vs. time’ graph shows a phase difference of 180°. This indicates that the acceleration is always opposite in direction to the displacement. Teaching notes
Aim: To find the force constant of a helical spring by plotting a graph between load and extension.
Aim: To find the effect of damping on an oscillating spring
Aim: To find the effect of mass on an oscillating spring
Aim: To use the formula for an oscillating spring to find m or k etc